
End-to-End Visibility: Building a Fabric Lineage Map with Microsoft Purview

In today’s data-driven world, organizations are embracing Microsoft Fabric to unify their analytics landscape — bringing together data engineering, data science, and business intelligence under one integrated platform. Yet as data moves across multiple services — from ingestion to transformation to visualization — the question remains: can you see its full journey?

That’s where Microsoft Purview comes in. Its data lineage capabilities give organizations the ability to trace data movement and transformation across the entire Fabric ecosystem — unlocking visibility, trust, and accountability.

Why Data Lineage Matters in Microsoft Fabric

Data lineage answers critical questions every data team should be able to answer instantly:

  • Where did this data originate?
  • How was it transformed?
  • Who modified it — and when?

In Microsoft Fabric, these questions extend across Lakehouses, Pipelines, Notebooks, Dataflows, Warehouses, and Power BI reports. Without lineage, teams risk using outdated or duplicated data, introducing compliance risks and eroding confidence in analytics outputs.

Lineage doesn’t just map technical dependencies — it enables governance, collaboration, and impact analysis at scale.

What Is a Fabric Lineage Map?

A Fabric lineage map is a visual representation of how data flows and transforms across Fabric components. It connects the dots between:

  • Source systems (e.g., Azure Data Lake Storage, SQL Databases)
  • Transformation layers (e.g., Dataflows Gen2, Notebooks, Pipelines)
  • Consumption points (e.g., Power BI semantic models and reports)

With Microsoft Purview, this map becomes interactive and auditable, allowing users to trace relationships, assess dependencies, and understand how sensitive data travels through the environment — from raw ingestion to business insights.

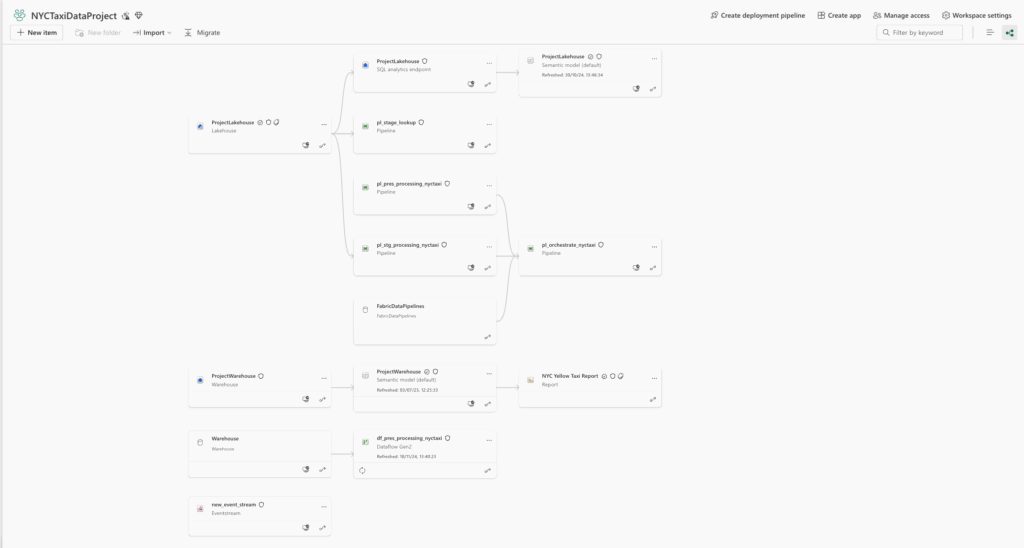
NYTaxi Data Lineage in Microsoft Fabric

Building a Fabric Lineage Map with Purview

Here’s how to establish end-to-end lineage in your Microsoft Fabric environment using Purview:

1. Connect Microsoft Purview to Fabric

Start by registering your Fabric workspaces in the Purview Data Map. You can connect:

  • Lakehouses and Warehouses
  • Pipelines
  • Power BI Workspaces
  • Notebooks and Dataflows

Purview automatically captures lineage for supported Fabric assets, and you can extend this through APIs for custom or external sources.

Connected Data Sources Flow in Microsoft Purview

2. Scan and Classify Assets

Run scans to discover metadata and classify sensitive data across Fabric. Purview uses built-in and custom classifiers to identify and label data as PII, Financial, Health, or Confidential.

This metadata foundation ensures your lineage view is not just complete, but also compliant.

3. Enable Lineage Capture

Ensure lineage capture is active for:

  • Dataflows Gen2 and Pipelines (captured natively through Fabric integration)
  • Power BI (enabled through tenant-level settings in the admin portal)

This step allows automatic lineage propagation between your Fabric workspace and Power BI datasets, reports, and dashboards.

4. Visualize Lineage in Purview Studio

Go to Purview Studio → Data Map → Lineage View to explore relationships across assets:

  • Upstream and downstream dependencies
  • Transformation steps and logic
  • Data owners, stewards, and custodians

This graphical view helps teams understand not only where data flows, but also how changes might ripple through the ecosystem.

5. Use Lineage for Impact Analysis

Before modifying a pipeline, deleting a dataset, or renaming a table, use lineage to assess:

  • Which reports and dashboards depend on this data?
  • Who needs to be informed before the change?
  • What policies or sensitivity labels apply downstream?

With Purview, impact analysis becomes proactive, not reactive.

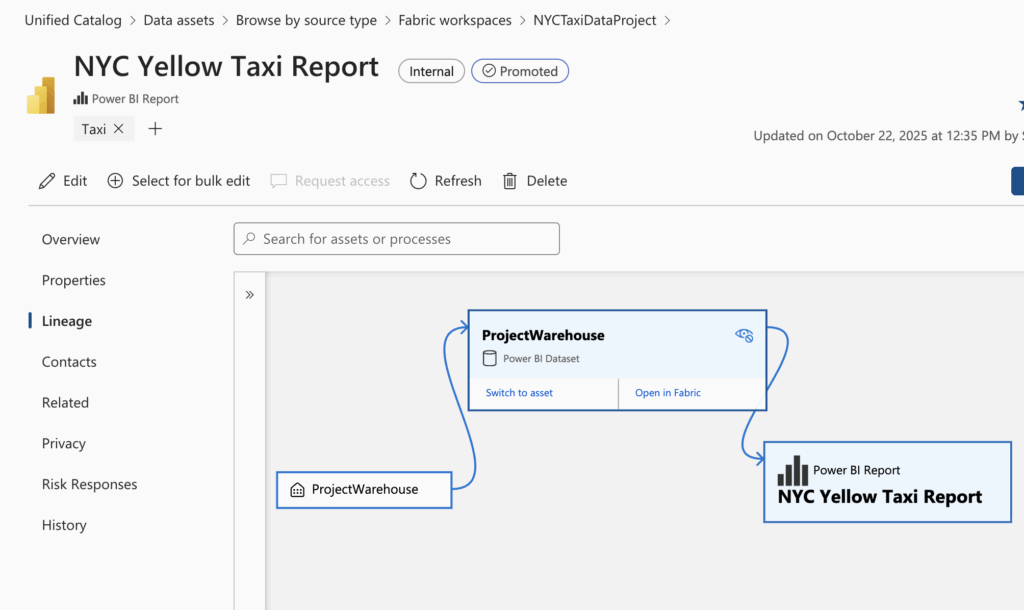
NYC Yellow Taxi Report Lineage

Governance Meets Visibility

Purview doesn’t just visualize lineage — it integrates governance directly into it. Sensitivity labels and data classification flow automatically through lineage paths, ensuring consistent data protection from source to report.

For example, when a dataset tagged as Confidential in a Lakehouse feeds a Power BI dashboard, Purview ensures that the Confidential label is retained and visible downstream. Combined with access policies and role-based permissions, this creates a governance model built on transparency and control.

Real-World Example: Accelerating Troubleshooting and Trust

Imagine a financial dashboard in Power BI suddenly displays inconsistent figures. With Purview lineage, you can trace the error path in seconds:

  • A Dataflow Gen2 transformation applied an incorrect join.
  • The Warehouse table wasn’t refreshed due to a failed Pipeline.
  • The Power BI semantic model used stale data.

Instead of spending hours debugging across systems, Purview provides a single view of dependencies — allowing teams to pinpoint root causes, reduce downtime, and restore trust in business reports.

Final Thoughts

Building a Fabric lineage map with Microsoft Purview is not just a technical exercise — it’s a strategic foundation for data transparency, compliance, and collaboration.

As organizations scale analytics across Microsoft Fabric, Purview becomes the compass that keeps data teams aligned — helping them see what’s flowing, know what’s sensitive, and act with confidence.

Start small. Connect one Fabric workspace to Purview, scan its assets, and explore your first lineage map. You’ll quickly see how visibility turns complexity into clarity — and data into trusted insight.

middle belt blog

Related Post